
Introduction
In the field of health care, social media drastically improves the efficiency of obtaining and disseminating health-related information.1–3 It has been shown that health-related social media use enhances patients’ disease management and improves patients’ overall health care experience through a positive impact on their subjective and psychological well-being.1,4 Subjective well-being refers to how people feel about their lives in positive ways, which often manifests as feelings of positive emotions. Gaining social and emotional support has been reported as one of the major reasons for which patients use social media.2,3 By communicating with people of similar experiences or reading their stories on social media, patients know that their situations are not unique and are aware of the community or network of support that is readily available to them.4 Therefore, patients demonstrate higher self-esteem and confidence in handling their medical conditions, more sense of normalcy, and fewer feelings of loneliness and anxiety, all of which result in an enhanced subjective well-being.4 On the other hand, psychological well-being refers to how people fulfill their potential of living a meaningful life.4 Because a central component of psychological well-being is a warming and trusting interpersonal relationship, people with enhanced psychological well-being often form more positive relationships with others. Studies have shown that social media promotes interpersonal relationship building not only between patients, but also between patients and health care professionals.3,5 Bringing the knowledge they acquire through social media to discuss with their physicians, patients demonstrate improved health literacy and autonomy, leading to better shared decision-making and more equal communication that results in a more harmonious relationship with health care professionals.1,6 The multifaceted impact of social media on patients’ well-being has been positively associated with patients’ health care satisfaction.7
However, the effect of social media use on patients’ well-being is not always positive. Exposed to negative emotions and bad experiences on social media, patients have demonstrated increased levels of worry and anxiety, leading to diminished subjective well-being.4 Manipulation of stories and an inability to trace the source of information have been ranked as 2 of the most significant challenges for health-related social media use.1 Negative health risk behaviors, such as unsafe sexual behavior, have been reported as consequences of following unreliable information online.3 Therefore, patients often show concerns and fear of misinformation as they browse social media, which further diminishes their subjective well-being. Also, the magnitude of information on social media can cause information overload, which can exacerbate anxiety because patients are uncertain as to how to apply online information to their personal situation.3 On the other hand, the information empowering effect of social media can create conflicts between patients and physicians in a bidirectional way.8 When patients blindly believe online information above that of their physicians, they may ignore physicians’ expertise. Subsequently, the intense discussion caused by different interpretations of online information often impair the patient-physician relationship. Feeling their authority is challenged, physicians can also discredit patients’ ability to be informed through social media by dismissing patient-acquired knowledge either explicitly or implicitly, which significantly impairs shared decision-making and results in a less-than-ideal health care experience for patients.6,8 Even when physicians accept patients’ use of social media, the extra time needed to decipher correct information from harmful advice can lead to physicians’ opposition that may compromise the patient-physician relationship.5,6
A positive HIV status is a chronic medical condition that disproportionally affects sexual minority populations.9 Management of HIV often requires longitudinal access to physicians and the establishment of long-lasting relationships with health care professionals. A positive patient-physician relationship is an essential part in managing HIV because patients who form better relationships with their physicians have been shown to be more adherent to treatment, resulting in better long-term outcomes.10 A systematic review by Taggart et al identified the benefits and limitations of using social media to communicate HIV prevention and treatment.11 Social media users discussing HIV are diverse in terms of geographic locations, sexual orientations, ages, genders, races, and socioeconomic status. Taggart et al11 also pointed out the effect of social media on the subjective and psychological well-being of patients with HIV. The anonymous nature of social media enables patients with HIV to share sensitive experiences that would otherwise be embarrassing to share offline; social media provides a channel through which patients with HIV dissipate fear, stigma, and discrimination, which enhances their subjective well-being. Also, due to the personal and isolated nature of the HIV experience, patients with HIV gain stronger social and emotional support as they develop a sense of community from interacting with other patients with HIV.11
Given the multifactorial effect of social media on patients’ subjective and psychological well-being, it is hypothesized that social media may influence the lifelong interaction between patients with HIV and physicians as well as impact the overall health care experience of patients with HIV. However, there is a paucity of research that addresses this point. In 2018, approximately 81% of new HIV diagnoses were attributed to men who have sex with men, marking this population of men as the most influenced group by HIV disease.9 Therefore, understanding whether there is an association between social media use and the patient-physician relationship among men who have sex with men living with HIV is important for the successful management of HIV. Therefore, the current study examines the association between social media use and health care satisfaction among middle-aged sexual minority men living with or without HIV.
Methods
Population
From 1984 to 2019, the Multicenter AIDS Cohort Study (MACS) investigated the natural and treated history of HIV among a cohort of more than 7000 sexual minority men across 4 sites in the US. Every 6 months, participants completed clinical visits to provide demographic information, medical history, behavioral assessments, and biospecimens using audio computer-assisted self-interviews and a standardized clinical examination. Details on the MACS study design have been described elsewhere.12,13 Understanding Patterns of Healthy Aging Among Men Who Have Sex With Men, a substudy of the MACS, sought to identify and understand psychosocial resiliencies that promote healthy aging among middle-aged and older sexual minority men living with and without HIV.14 It was conducted semiannually between April 2016 and March 2019. To be eligible, MACS participants (1) had be at least 40 years old on or before April 2016; (2) reported at least 1 incident of sexual intercourse with another man since enrolling in the MACS; and (3) completed 2 consecutive MACS visits prior to April 2016. More than 1300 MACS participants enrolled in the substudy. The current analytic sample included 1063 participants (528 persons living with HIV [PLWH] and 535 persons living without HIV [PLWOH]) with survey data between October 2017 and March 2018 (MACS visit 68).
Measures
Health care satisfaction was assessed using the General Satisfaction and Technical Quality subscales of the Patent Satisfaction Questionnaire Short Form (PSQ-18).15 The response choices were strongly disagree, disagree, neutral, agree, strongly agree, prefer not to say, and not applicable. Item responses were recoded prior to analyses. The prefer not to say and not applicable responses were set to missing. Strongly agree/agree and strongly disagree/disagree were collapsed into agree and disagree, respectively. Negatively worded items were reversed coded.
The primary communication method was assessed by asking participants to rank their top 3 methods for communicating with someone whom they can trust and depend on. The options for communication methods were in-person, email, telephone, text messaging, video chatting, and video gaming. Primary communication method was categorized as computer-mediated if they ranked email, telephone, text messaging, video chatting, or video gaming higher than in-person. Primary communication method was categorized as in-person if they ranked in-person communication over computer-mediated communication.16
Covariates
Age was calculated from date of birth and the survey completion date. Race and ethnicity were self-reported and categorized as Hispanic, non-Hispanic Black, non-Hispanic White, and Other. Education was categorized as high school diploma or less and at least some college. HIV status (PLWH or PLWOH) was obtained using enzyme-linked immunosorbent assay with a confirmatory Western blot on all participants at their initial visit and at every visit for PLWOH at the previous visit. PLWH included all participants who were identified as such at their initial visit and those who seroconverted during study observation. Current insurance coverage was categorized as yes or no.
Statistical Methods
Descriptive statistics were generated on all variables, overall and by HIV status, using medians and IQRs and frequencies/percentages where appropriate. Latent class analysis was used to identify mutually exclusive latent classes by modeling indicators of health care satisfaction. Model selection was performed using a stepwise approach, testing up to 4 classes. Model fit statistics included sample size–adjusted bayesian information criterion (BIC), entropy, the Lo-Mendell-Rubin adjusted likelihood ratio test (LMR LRT). The model with the optimal number of classes had lower BIC values, high entropy (≥0.7), and statistically significant LMR LRT P value (<.05).17,18 Homogeneity (the degree to which the item response probabilities are close to 0 or 1) and latent class separation (the degree to which latent classes can be distinguished from one another) were also considered. Parameters estimated in latent class analysis were latent class membership probabilities and item response probabilities. Participants were assigned to the classes for which they had the highest posterior probability of membership based on their responses to the indicators (item response probability). Multinomial logistic regression was used to estimate the effect of primary communication method on health care satisfaction class membership, adjusting for HIV status, race and ethnicity, age, education, and insurance coverage. We also tested the interaction between HIV serostatus and primary communication method. Statistical significance was defined at the P < .05 level. Adjusted odds ratios (aORs) and their 95% CIs were reported. Analyses were performed in Mplus version 8.7 and SAS version 9.4.
Results
Descriptive Statistics
Participants (PLWH: 49.7% and PLWOH: 50.3%) had an overall median age of 61 years (IQR, 55-67). Most were non-Hispanic White (68.6%), reported at least some college education (84.9%), reported a median of 2 comorbidities (IQR, 1-2), and were currently insured (65.3%). Most participants reported satisfaction with their health care (75.3%) (Table 1). Most participants also ranked in-person communication first (66.2%) as their primary method of communication, followed by telephone ranked second (44.9%), and texting ranked third (26.6%) (Table 1). Details by HIV status are reported in Table 1.
Model Selection
Model fit statistics for 1- to 4-class models are reported in Table 2. The 4-class solution had the lowest BIC (7405.596) and highest entropy (0.892). However, the LMR LRT was no longer statistically significant after the 3 classes, which indicates that the model does not improve beyond the 3-class solution. In addition, the 3-class model demonstrated higher homogeneity and latent class separation compared with higher-class solutions. Ultimately, the optimal number of classes selected was 3. The BIC, entropy, and LMR LRT P value of the final 3-class model was 7439.542, 0.868, and 0.000, respectively (Table 2).
Latent Classes of Health Care Satisfaction
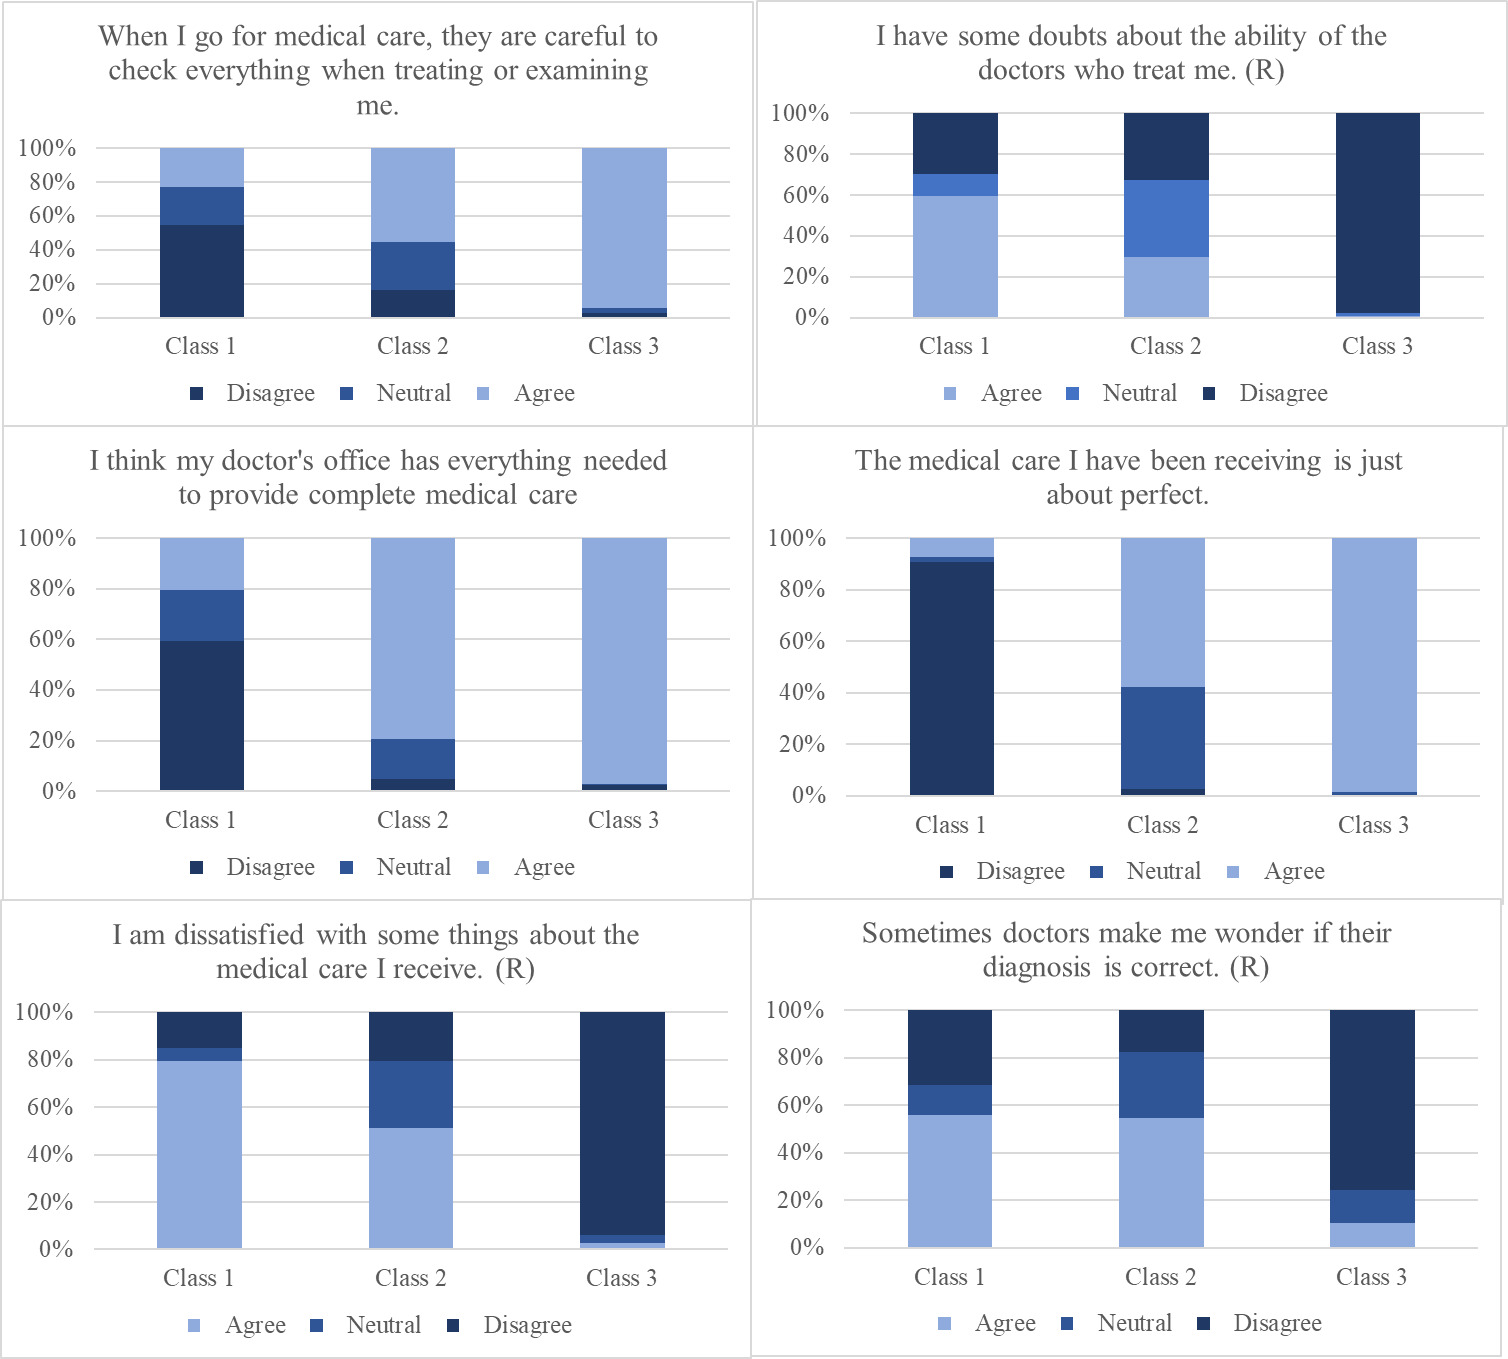
We identified 3 mutually exclusive classes in our analytic sample. Visual representation of the item response probabilities by class are displayed in the Figure. Class 1 (6.7% of the sample) can be described as having low health care satisfaction. Large proportions of participants in this class believed the following: (1) their medical provider was not careful in checking everything (54.9%); (2) they had doubts in their providers’ ability to treat them (59.3%); (3) they disagreed that their provider has everything needed for complete care (59.5%); (4) they disagreed that their medical care is just about perfect (90.8%); (5) they were dissatisfied with some things regarding their medical care (79.3%); and (6) they sometimes wondered if their diagnosis is correct (56.1%). Class 2 (29.5% of the sample) had low to moderate level of health care satisfaction. They differed from class 1 in that they believed their medical provider checked everything during examination (55.3%), their medical provider had everything needed to provide complete care (79.5%), and the medical care they received was just about perfect (57.6%). Class 3 (63.8% of the sample) can be described as having high health care satisfaction. Their responses were largely opposite from those of class 1.
Multivariate Association of Primary Communication Method and Latent Classes
The multinomial logistic model used membership in class 3 (high health care satisfaction) as the referent group. Computer-mediated communication as the primary method of communication was associated with increased odds of membership in the low health care satisfaction class (class 1) vs primarily in-person communication (aOR, 1.21 [95% CI, 0.58-2.53]; P = .62). While computer-mediated communication was associated with decreased odds of membership in the low to moderate health care satisfaction class (class 2) (aOR, 0.85 [95% CI, 0.53-1.36]; P = .498) (Table 3). However, these associations were not statistically significant. There also was no statistically significant interaction between HIV serostatus and communication method. Regarding covariates, we found that not having current insurance coverage was associated with membership in the low health care satisfaction class (aOR, 7.84 [95% CI, 1.81-33.96]; P = .004). PLWH (vs PLWOH; aOR, 0.66 [95% CI, 0.43-0.99]; P = .04) and those with a high school education or less (vs any college; aOR, 0.48 [95% CI, 0.26-0.91]; P = .03) was associated with decreased odds of membership in the low to moderate health care satisfaction class (Table 3).
Discussion
Our study found that most participants, regardless of their HIV status, preferred in-person communication over computer-mediated communication and were generally satisfied with the health care they received. Compared with those who preferred in-person communication, participants who preferred computer-mediated communication were more likely to have low health care satisfaction and less likely to have low to moderate health care satisfaction. However, these associations were not statistically significant. Compared with those with high health care satisfaction, participants with low health care satisfaction were more likely to have the following characteristics: living without HIV, having younger age, being White and non-Hispanic, having less than a high school education, having fewer comorbidities, and not having insurance. All associations, except insurance status, were not statistically significant. Compared with those in the high health care satisfaction class, participants with low to moderate health care satisfaction were more likely to have the following characteristics: living without HIV, being Hispanic, having higher than a high school education, having fewer comorbidities, and not having insurance. Among these associations, only HIV status and the educational level were statistically significant. Finally, our study demonstrated that HIV status did not statistically impact the relationship between communication method and health care satisfaction.
In 1992, Walther et al19 reintroduced the social information processing (SIP) theory, a theoretical framework that examines the relationship between communication method and the use of different kinds of communicative cues. The SIP theory suggests that communicators rely on and shift to any available cues to achieve information exchange and relationship building. Specifically, when nonverbal cues (facial expression, body movement, gestures) are limited or lacking during computer-mediated communication, communicators compensate by exploiting characteristics of verbal (language) or text-based (eg, syntax, wording) cues to achieve the same level of communication effectiveness and relationship building as in-person communication. For example, during computer-mediated communication, people devote a greater proportion of conversations in asking more direct and intimate questions.19 Applying to communication between patients and physicians, the SIP theory is supported in the context of both text-based and web-based communication. In the study by Mirzaei and Kashian,20 patients reported the same level of communication effectiveness with physicians when using text-based communication (eg, email, texts, patient-portals) compared with face-to-face communication. Similarly, Tates et al7 found no statistically significant difference in the level of informational exchange, rela2tionship building, and shared decision-making when comparing web-based consultation with an in-person visit. However, our study suggested that most patients prefer in-person communication over computer-mediated communication and have higher health care satisfaction when communicating face to face. While it seems that our results opposed the SIP theory as the SIP theory predicts that patients’ satisfaction level will be similar in computer-mediated communication and in-person communication, we postulated that the process of communicating face to face with physicians can be more rewarding and satisfying through the expression of empathy and warmth by physicians with nonverbal cues. It has been shown that nonverbal cues, such as smiling, eye gazes, forward lean, and body orientation, are associated with greater intimacy and involvement.19 Thus, despite physicians’ shift to using more verbal cues predicted by the SIP theory, the experience of face-to-face communication cannot be replicated and is still preferred by patients.
The results of our study reflected those from a sample of older study participants. It has been shown that despite a general trend towards acceptance of digital health care, older patients are more reluctant to embrace change.21 Our findings may represent the tendency of middle- and older-aged patients to remain satisfied with the traditional in-person model of health care. Therefore, even though digital communication can provide a comparable patient experience as suggested by the SIP theory, our study participants may still choose in-person communication in which they are most comfortable.
Regarding HIV management, our study indicated that whether patients used computer-mediated or in-person communication had no effect on patients’ health care satisfaction. Given the general high health care satisfaction level of our sample, our finding fits the SIP theory, which supports a comparable level of user satisfaction between computer-mediated communication and in-person communication. However, our findings were at odds with an existing study in which 70% of patients living with HIV were dissatisfied with digital HIV care.22 The study by Baim-Lance et al22 noted that the remaining 30% of patients with HIV who preferred digital HIV care had established long-lasting relationships with their physicians and primarily addressed nonurgent medical needs that could be provided by nonemotive verbal communication. Similarly, in our study, most participants living with HIV had been virally suppressed for a long period; therefore, it is likely that the needs of patients with HIV in our study may have been mostly satisfied by simple information exchange when they visited their regular health care providers. When the visit is mainly routine and informational, computer-mediated communication can lead to a comparable level of patient satisfaction as in-person communication due to its easiness and effectiveness in information-sharing as suggested by Taggart et al11 in their systematic review. However, when complex decision-making or emotional consulting is needed, digital communication may not satisfy patients’ emotional needs despite exploitation of verbal cues. Therefore, our study suggested that the context of consultation is important in determining the effect of digital communication on patient satisfaction.
Finally, our study showed that a lower educational level was negatively associated with low to moderate health care satisfaction. It has been shown that physicians tend to spend a higher proportion of time on counseling, history taking, assessing patients’ understanding, negotiating, and providing health-promoting advice with less-educated patients.23 These behaviors can be interpreted by patients as actions of care and attentiveness, resulting in higher patient satisfaction. Also, our study found that patients without insurance coverage were positively associated with low health care satisfaction. Such a correlation has been documented in the existing literature.24–26 The low satisfaction of patients without health care insurance is reflective of the financial burden of these patients to afford expensive health care and decreased odds of having a regular health care provider.24–26 Also, many physicians have reported that they frequently alter their clinical management based on patients’ insurance status, which may lead to patient inconvenience as physicians steer away from the most efficient plan of treatment toward less-expensive options for patients with no insurance.27
Limitations
There were several limitations to the current study. First, our study treated computer-mediated communications as a generic category and failed to differentiate the different types of computer-mediated communication. For example, while nonverbal cues are completely lacking in email and text, video consultation using Zoom enables passage of some nonverbal cues (eg, eye movement, smiling) to a large extent. Thus, future research should attempt to isolate each kind of digital communication method and its influence on patient satisfaction. Second, our study and most existing studies only support the SIP theory at a macrolevel by showing a comparable level of health care satisfaction when patients use computer-mediated communication and face-to-face communication. However, few studies have examined the behavioral changes of physicians and patients to accommodate different mediums of communication. Therefore, our explanation of the results remains a postulation of the SIP theory. Future research could attempt to investigate the SIP theory at the microlevel to complete the picture. Third, because most MACS participants living with HIV are virally suppressed, it is possible that they tend to rate their satisfaction with health care high, which may be a potential social desirability bias. Similarly, our study relied on participants’ self-report of their preferred method of communication, which may also be subjective to social desirability bias. It has been shown that people tend to underestimate their use of smartphones and social media because excessive use of digital devices is considered a socially undesirable behavior in many settings.28 On the other hand, as smartphone use has become a norm in today’s society, it is likely that people without smartphones intentionally report smartphone use to avoid being labelled as outliers, although we haven’t found any existing studies that have documented this. Fourth, our sample consisted of primarily White and college-educated individuals, so our results may not be generalizable to other men living with HIV. Whether our findings would be different among middle-aged and aging women living with HIV requires additional study.
Conclusions
This study showed that middle-aged men living with or without HIV primarily prefer in-person communication over digital communication, but the method of communication generally has no impact on the overall health care satisfaction of patients with HIV. We further postulated that patients’ preferred method of communication may depend on the context of the consultation. Considering the current guidelines regarding HIV management, our study may have clinical implications to maximize the possibility of patients with HIV to establish long-term care with health care professionals. To better achieve viral suppression and mitigate viral transmission in the care of HIV, the Centers for Disease Control and Prevention proposes the HIV care continuum that outlines the 4 essential steps for successful management of HIV: diagnosed, linked to care (visit an HIV health care professional within 30 days of diagnosis), retained in care, and viral suppression.29 It has been shown that of all people who have received a diagnosis of HIV, 74% were linked to care, and only 58% were retained in care.29 Our study may point to a potential way to mitigate the significant loss of patient follow-up across the continuum. Health care professionals should encourage in-person visits for patients with newly diagnosed HIV to maximize their possibility to be retained in HIV care. On learning of their HIV diagnosis, patients often react extremely negatively including disbelief, hopelessness, frustration, traumatization, and even suicidal ideation.30 While these negative emotions usually fade away eventually, it has been shown that consultation with healthcare providers and establishment of care significantly facilitate patients’ transition to self-acceptance.30 Therefore, digital communication may be inadequate in addressing patients’ emotional needs. On the other hand, based on the current guideline on HIV assessment and monitoring, only annual testing is recommended for patients who have been taking antiretroviral therapy for 2 years and have a consistently suppressed viral load.31 For these patients, digital health care is recommended due to its convenience and efficiency in addressing needs for routine follow-up visits.
Acknowledgments
The authors are indebted to the participants of the Multicenter AIDS Cohort Study (MACS) Healthy Aging Substudy. The authors thank the staff at the 4 sites for implementation support and John Welty, Montserrat Tarrago, and Katherine McGowan for data support of this study.
Disclaimers
None reported.
Sources of Support
This study was funded by the National Institute on Minority Health and Health Disparities (grant R01 MD010680; Plankey and Friedman). The contents of this publication are solely the responsibility of the authors and do not represent the official views of the National Institutes of Health (NIH). MACS/WIHS Combined Cohort Study (MWCCS) (principal investigators): Atlanta CRS (Ighovwerha Ofotokun, Anandi Sheth, and Gina Wingood), U01-HL146241; Baltimore CRS (Todd Brown and Joseph Margolick), U01-HL146201; Bronx CRS (Kathryn Anastos and Anjali Sharma), U01-HL146204; Brooklyn CRS (Deborah Gustafson and Tracey Wilson), U01-HL146202; data analysis and coordination center (Gypsyamber D’Souza, Stephen Gange, and Elizabeth Golub), U01-HL146193; Chicago–Cook County CRS (Mardge Cohen and Audrey French), U01-HL146245; Chicago-Northwestern CRS (Steven Wolinsky), U01-HL146240; Connie Wofsy Women’s HIV Study, Northern California CRS (Bradley Aouizerat, Phyllis Tien, and Jennifer Price), U01-HL146242; Los Angeles CRS (Roger Detels), U01-HL146333; Metropolitan Washington CRS (Seble Kassaye and Daniel Merenstein), U01-HL146205; Miami CRS (Maria Alcaide, Margaret Fischl, and Deborah Jones), U01-HL146203; Pittsburgh CRS (Jeremy Martinson and Charles Rinaldo), U01-HL146208; UAB-MS CRS (Mirjam-Colette Kempf, Jodie Dionne-Odom, and Deborah Konkle-Parker), U01-HL146192; and UNC CRS (Adaora Adimora), U01-HL146194. The MWCCS is funded primarily by the National Heart, Lung, and Blood Institute, with additional co-funding from the Eunice Kennedy Shriver National Institute of Child Health and Human Development, National Institute on Aging, National Institute of Dental and Craniofacial Research, National Institute of Allergy and Infectious Diseases, National Institute of Neurological Disorders and Stroke, National Institute of Mental Health, National Institute on Drug Abuse, National Institute of Nursing Research, National Cancer Institute, National Institute on Alcohol Abuse and Alcoholism, National Institute on Deafness and Other Communication Disorders, National Institute of Diabetes and Digestive and Kidney Diseases, National Institute on Minority Health and Health Disparities, and in coordination and alignment with the research priorities of the NIH, Office of AIDS Research. MWCCS data collection is also supported by UL1-TR000004 (UCSF CTSA), P30-AI-050409 (Atlanta CFAR), P30-AI-050410 (UNC CFAR), and P30-AI-027767 (UAB CFAR).
Student effort was supported by the Mitchell Summer Research Project at Georgetown University School of Medicine.
Conflicts of Interests
None reported.