


Introduction
Of the surgical approaches used for total hip arthroplasty (THA), the posterior approach is currently the most commonly used in the United States.1 However, the anterior approach has gained popularity based on the belief that it may result in less pain, shorter lengths of stay in hospital, decreased risk of dislocation, and improved hip stability for patients. Specifically, it has been shown that the anterior approach may have benefits over the posterior approach in reducing muscle damage and inflammation,2 reported joint pain and function, postoperative length of stay, postoperative narcotic consumption, and dislocations.1 However, there is speculation that other factors, such as patient and family education, analgesic protocols, patient selection, and rehabilitation, have a more influential role in THA outcomes. Currently, there is no conclusive evidence showing clear superiority of outcomes for either approach.1
Because the posterior approach has traditionally been more commonly used, it would be expected that the time and skill needed by surgeons to learn the anterior approach could pose complication risks. A surgical learning curve is defined as “the time taken and/or the number of procedures an average surgeon needs to be able to perform a procedure independently with a reasonable outcome.”3 In this study, THAs performed by a single orthopedic surgeon at the MedStar Washington Hospital Center were longitudinally compared. The surgeon learned how to perform the posterior approach for THA in residency training (2006-2011 at MedStar Georgetown University Hospital), and he learned the anterior approach after his residency training. THAs are ideal as a means to investigate the learning curve of a procedure because their long-lasting effects allow for comparison among patients out of the recovery phase for procedures done in different years. In a 20-year study following 63 158 patients who underwent a THA, the 10-year replacement survival rate (ie, a revision surgery was not needed) was more than 95% and the 20-year survival rate was 85%.4 This suggests that the positive effects of THAs are generally long-lasting and should allow for relatively equal comparisons, even years after the procedure.
In another study attempting to characterize the learning curve of the anterior approach in practice, researchers reviewed outcomes from a single surgeon’s series of 1000 initial anterior THAs in comparison to outcomes of the posterior approach.5 Results showed that there was an initial increase in both procedure and operating room (OR) times for the newly learned anterior approach compared with the previously used posterior approach. However, the procedure times became equal at the 400th anterior approach case and significantly shorter after the 850th case. The OR times took longer to equilibrate, reaching statistical equivalence after the 900th case.5 The current study aims to add data to this ongoing discussion regarding the learning curve of transitioning from the posterior approach to the anterior approach for THAs. However, rather than a focus on OR and procedural times, our study investigates outcomes related to pain and recovery from the patient’s perspective.
The Forgotten Joint Score (FJS) is a questionnaire that measures “patient-perceived pain.” In its validation study,6 the FJS exhibited high internal consistency (Cronbach α = 0.95) and lower ceiling effects than that of the Western Ontario and McMaster Universities osteoarthritis index subscales (16.7% vs 46.7%). The FJS continued to maintain lower ceiling effects in subsequent studies, such as in an evaluation comparing the FJS vs the well-established Oxford Hip Score (21% vs 31%).7 By lowering the “ceiling effect” of patient-reported outcomes, the FJS essentially is able to better reflect differences among so-called “good” outcomes because it was shown to be highly discriminative in a sample of 243 patients with known-group comparisons.6 This suggests that it is a good reflection of a “forgotten joint” due to its measurement range reflecting differences between “good,” “very good,” and “excellent” rather than simply differences between “good” and “bad” outcomes. The FJS has also shown high internal consistency across many studies, which implies that the individual questions on the survey consistently cover the intended concept of joint awareness.7 In the current study, postoperative THA outcomes are compared using the FJS for both the anterior and posterior approaches in an attempt to gain a better understanding of the learning curve associated with a new surgical technique.
Materials and Methods
Approval for this study was obtained from the institutional review board of Georgetown-MedStar. Current Procedural Terminology codes were used to identify all patients (from December 1, 2012, through October 31, 2018) who underwent THAs by the surgeon. A retrospective medical record review was conducted to determine surgical characteristics such as the number of concomitant procedures, types of procedures, and complications. THAs with surgical revisions, conversions, or explants were excluded from the study with the reasoning that these procedures are not standard and would confound patient-reported outcomes. However, this reasoning poses its own limitations (see the Discussion section). Surgical procedures performed more recently than the time period of interest were also excluded to prevent confounding outcomes from patients still in the recovery phase. All procedures of interest were performed at MedStar Washington Hospital Center in Washington, DC.
Patients were contacted and asked to participate in a voluntary research study regarding their THA postoperative pain. For all patients fulfilling both the inclusion and exclusion criteria (Table 1), initial contact was attempted via email if there was an email address listed in the patient’s medical record. For those whose survey responses were not received (after initial attempted email contact), telephone calls were made to all remaining patients with telephone numbers listed in their medical record. All of these patients were called at least twice and left a generic voicemail inquiring about their potential interest in a research study at Georgetown.
The FJS questionnaire (version 1.1) was administered with the consent of the survey developers using REDCap (Research Electronic Data Capture) electronic data capture tools hosted at Georgetown University. REDCap is a secure, web-based application designed to support data capture for research studies, providing (1) an intuitive interface for validated data entry; (2) audit trails for tracking data manipulation and export procedures; (3) automated export procedures for seamless data downloads to common statistical packages; and (4) procedures for importing data from external sources.8 A link to provide written consent and answer the survey was provided via email to each patient who verbally consented to participating in the survey. The questions and scoring algorithm of version 1.0 the FJS questionnaire yield identical results as version 1.1 of the FJS questionnaire. However, only version 1.0 is currently available to be reprinted. Because of this, version 1.0 of the FJS questionnaire is presented in the methodology.
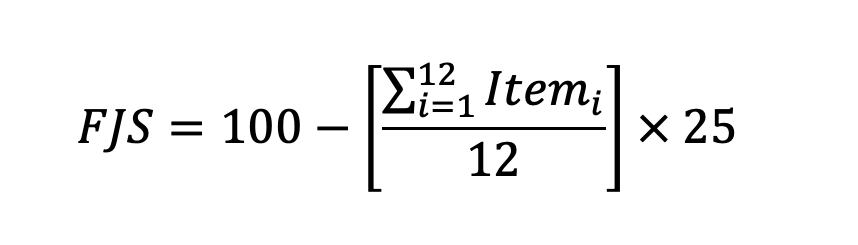
Each patient’s overall total FJS was calculated using the FJS scoring algorithm (Figure 1) by assigning a numerical value to each response along the spectrum, ranging from 0 (never) to 4 (mostly). The arithmetic mean of the numerical values for each question was then calculated and multiplied by 25. This multiplication product was then subtracted from 100 to reach the final FJS. A higher FJS indicates a better outcome, while a lower score indicates a poorer outcome. When there was a missing response for any of the questions, the arithmetic mean of the remainder of the patient’s answers was used to replace the missing value. If there were more than 4 missing responses for any given survey, the survey was treated as incomplete and not included in the analysis.


All deidentified data were sent to biostatisticians at Georgetown University for analysis. The biostatisticians performed a 5-number summary, a Shapiro-Wilk test for normality, a Bartlett test of homogeneity of variances, a nonparametric Wilcoxon rank-sum test, a Kruskal-Wallis test, and 2-way analysis of variance (ANOVA) tests for approach and year relationships to FJS.
Results
A total of 246 patients were contacted, for 296 cases (some patients had operations on both hips). Forty patients answered the survey to completion for 48 cases, achieving a survey response rate of 16.26% and 16.22% for patients and cases, respectively. One of the surveys was removed from the data because the patient provided a name that was not in the electronic medical record, thus making it impossible to determine the surgical approach taken for their procedure (final n=39 patients and 47 cases). Patient demographics are shown in Table 2. Of 564 total survey responses, 7 question responses were missing from 5 cases, and the numerical mean of the remaining values replaced the missing value(s).
Wilcoxon rank-sum test showed that the median/distribution of FJS was not significantly different between approaches. Despite a higher mean FJS value for the anterior approach (77.55; standard error of the mean [SEM], 5.27; n=29 THAs) than the posterior approach (69.42; SEM, 7.19; n=18 THAs), there was no significant difference found between groups (P = .38) (Figure 3). Furthermore, 2-way ANOVA indicated that the approach used was not statistically significantly associated with FJS (P = .34). Although both distributions (Figure 4) ranged from 0 to 100, the anterior group exceeded the posterior group’s first quartile (66.67 vs 54.58), median (87.50 vs 77.08), and third quartile (100.00 vs 95.31).


Chronological analysis was performed to assess for impact of surgical year on FJS. Kruskall-Wallis tests showed that the median/distribution of FJS was not statistically significant among years that the surgery was performed. Two-way ANOVA indicated that surgery year was not statistically significantly associated with FJS (P = .22).
Ceiling effects were calculated as the percentage of responses with the maximum score. The ceiling effects were 27.59% for the anterior group and 22.22% for the posterior group (25.54% overall). These ceiling effects were higher than those shown in the FJS validation study, but still noticeably lower than the Western Ontario and McMaster Universities osteoarthritis index and Oxford Hip Score.6,7 While a higher anterior group ceiling effect does signify that the FJS was not as discriminative for positive outcomes, it also suggests that this group may have had better outcomes because a higher percentage of patients reported the highest possible outcomes (resulting in maximum FJS value).
The Shapiro-Wilk normality tests showed that neither responses for the anterior or posterior approach were normally distributed (P < .05). The Bartlett test of homogeneity showed that the approaches had equal variances (P = .58) (Appendix).
Discussion
A few limitations of our study should be addressed. There was a relatively small sample size (n = 47 THAs) due to our weak survey response rate (less than 20% for both patients and cases). For comparison, a meta-analysis found that the average response rate for all e-mail surveys to be 33%.9 We attributed this to the fact that most patients did not have an email contact listed, leading us to cold call most of the patients in the pool. Although we left voicemails at least twice for those patients who did not answer telephone calls, we did not receive any calls back from anyone who was left voicemails. One rationale for the poor survey response rate was that many patients were contacted many years after their procedure (up to 6-7 years for some of the posterior procedures). This could explain why most survey responses came from patients who had undergone the anterior procedure, which the surgeon had used more frequently in recent years. Additionally, multiple studies have shown that increased use of the internet has resulted in “over-surveying” becoming commonplace in the United States, leading to a decline in email survey response rates over time.10,11 Another study found the response rate of physical mail to be relatively greater than e-mail by about 62% (53% for mail survey and 33% for email survey)10; however, because our consent process was set up through REDCap, we had to obtain consent electronically via email. Future studies should take into account the power of using physical mail to obtain consent and survey responses, and should realize potential weaknesses associated with calling and emailing.
The main metric for our study (patient-perceived pain measured using the FJS) is inherently subjective, and some patients may have related more strongly than other patients to particular questions in the FJS. This survey study design lends to a potential nonresponse bias, in that those who responded may have had more extreme (better or worse) outcomes. This is a relatively common theme across survey-oriented studies. A cross-sectional study of 717 hospital survey studies found the estimated response propensity function for an individual to be J-shaped according to patient satisfaction levels: the probability of responding was lowest for those with patient satisfaction scores in the middle range, while higher for both those who were maximally satisfied and those who were least satisfied.12
Furthermore, this study described outcomes from a single surgeon (N=1): a surgeon who already was proficient with the posterior approach and who had begun transitioning to the anterior approach. The combination of only investigating outcomes from 1 surgeon and that surgeon’s specific sequence of learning the different approaches should prompt extreme caution when extrapolating any conclusions to other surgeons or scenarios.
Because the surgeon exclusively used the posterior approach prior to 2016, and gradually transitioned to primarily using the anterior approach after 2016, we had some initial concerns about globally comparing “current pain” among populations that are inherently on different recovery timelines. However, because the effects of hip replacements tend to be long lasting (generally 10 years or more), there was less concern for the pain getting worse for the older procedures confounding the study than there was for ensuring that the recent procedures had adequate time for recovery. A retrospective analysis found that average FJS values were significantly higher 2 years after a THA procedure than 1 year after.13 This indicated that there may have been continued clinical improvement of THA outcomes for at least 2 years following the procedure. Because the surgeon primarily performed posterior THAs before he performed anterior THAs, theoretically, his posterior THAs would have had more time for improvement while some of his more recent anterior THAs may not have had adequate time to reach maximum recovery levels by the summer of 2019. While we did not extrapolate beyond the 2-year mark that the data show, there is still the possibility that the anterior FJS values could appear lower than if the 2-year mark had been reached for all patients before taking the survey. This consideration is especially relevant considering 17 of the 29 anterior FJS values (58.62%) were collected within 2 years of the surgical date and 2 of 29 (6.89%) were collected within 1 year. This contrasts sharply with the posterior group, which contained no patients whose data were collected within 2 years of their surgery. Had we limited our study data to procedures 2 or more years out from surgery, there may have been a greater difference of means between groups. However, this would have limited sample size significantly and would not have allowed for full exploration of the FJS along a chronological timeline in order to investigate the learning curve. Nevertheless, future studies regarding THA outcomes should certainly consider collecting data after the 2-year mark in order to control for variable recovery time confounding results.
Our study excluded patients with revisions, conversions, or explants to prevent additional confounding procedures from impacting patient-reported outcomes. However, this decision posed its own limitations because there was the possibility that 1 approach may lead to more complications, thus requiring additional procedures. Additionally, another potential confounding variable was the potential for different rehabilitation protocols for the different procedures, for example, the surgeon uses additional rehabilitation precautions for posterior procedures. However, there was no period of immobilization for either cohort and early physical therapy was implemented at the same time following both approaches. Patient compliance with the physical therapy protocols was not able to be collected, but it could be collected as additional data for consideration in future studies.
To our knowledge, this is the first study to compare anterior and posterior THA approaches in the context of the FJS. Further research is needed, specifically in the context of learning a new surgical approach.
Conclusion
There was no statistically significant difference found in FJS values between the anterior and posterior THA approaches overall. However, the mean, median, and first and third quartiles were higher for the anterior approach, supporting existing literature that suggests that the anterior approach may pose fewer complications and a smoother recovery for patients. When the specific dates of the procedures were considered, no significant association between the surgical date and FJS outcomes was found; therefore, we cannot conclude with scientific confidence that the learning curve of the anterior approach produced any consequences for the surgeon’s patients. However, these findings indicate more research is needed to investigate the learning curve because our data suggest that with a larger sample size it may be a clinically significant factor to consider.
Acknowledgements
The Georgetown Medical Review is grateful to D. Childers, J. Weiss, and an additional unnamed reviewer for peer-reviewing this publication.